
Share article
Agency SEO Report: How to Check the Work, Traffic, and Leads
Send via messenger or social network
Agency SEO Report: How to Check the Work, Traffic, and Leads

What data to request from an agency, how to recalculate percentages and cross-check enquiries with the CRM. Report structure and questions for the monthly meeting.

The agency has sent a report: search visibility has increased, technical errors have been fixed, and new articles have been published. Meanwhile, the CRM shows fewer relevant inquiries. To understand why, you need to compare these data points — an overall traffic chart will not provide the answer.
The report needs to connect three things: what was changed on the website, where search performance changed, and what happened to inquiries. Without that link, it is difficult to choose tasks for the next month and assess their cost.
We’ll show what information to request from the contractor and how to check the calculations using the example of a company that supports IT infrastructure. The figures in the tables are illustrative; the formulas and questions can be used in your own report.
The first five lines should explain the situation
Start the report with a brief summary: inquiries and search, completed implementations, reasons for deviations, and open tasks. Detailed exports should support these conclusions, not replace them.
Based on this summary, you can open the IT outsourcing pages, check the sources of growth, and decide whether the offer needs to be refined. Ask for this level of detail for each priority business area.
Also state any limitation: for example, the form was changed in the middle of the period, and some inquiries did not reach the CRM. This affects the conclusion, so it should not be hidden in a note on the last page.
First, agree on what exactly you define as a result
A website may offer five contact methods: a form, phone, messenger, email, and booking a meeting. A click on a phone number is not yet a completed call. A form submission is not necessarily a new inquiry: the same person may have submitted it twice.
Agree on the definitions and record them next to the metrics. For B2B, it is especially important to distinguish an inbound inquiry from a qualified one: for example, the company is located in a region you serve, is the right size, and is asking for the relevant service.
| Metric | Working definition | What can distort the number |
|---|---|---|
| Search visit | A visit counted according to the selected analytics rules | Changes to source tracking and attribution settings |
| Inquiry | A unique inbound inquiry through the agreed channels | Duplicates, spam, repeat inquiries |
| Qualified inquiry | An inquiry that met the sales department’s criteria | The criteria changed in the middle of the month |
| Deal | A sales opportunity entered in the CRM according to the company’s rules | Automatic creation for every spam lead |
| Sale | An order or contract in the agreed status | Different managers interpret the status differently |
Do not ask the agency for a revenue figure if the CRM does not record the source and the deal closing. But you cannot postpone measurement setup indefinitely, either. The report should include a specific task: what data is missing, who will fix it, and when the metric can be used.
A single percentage can hide opposite events
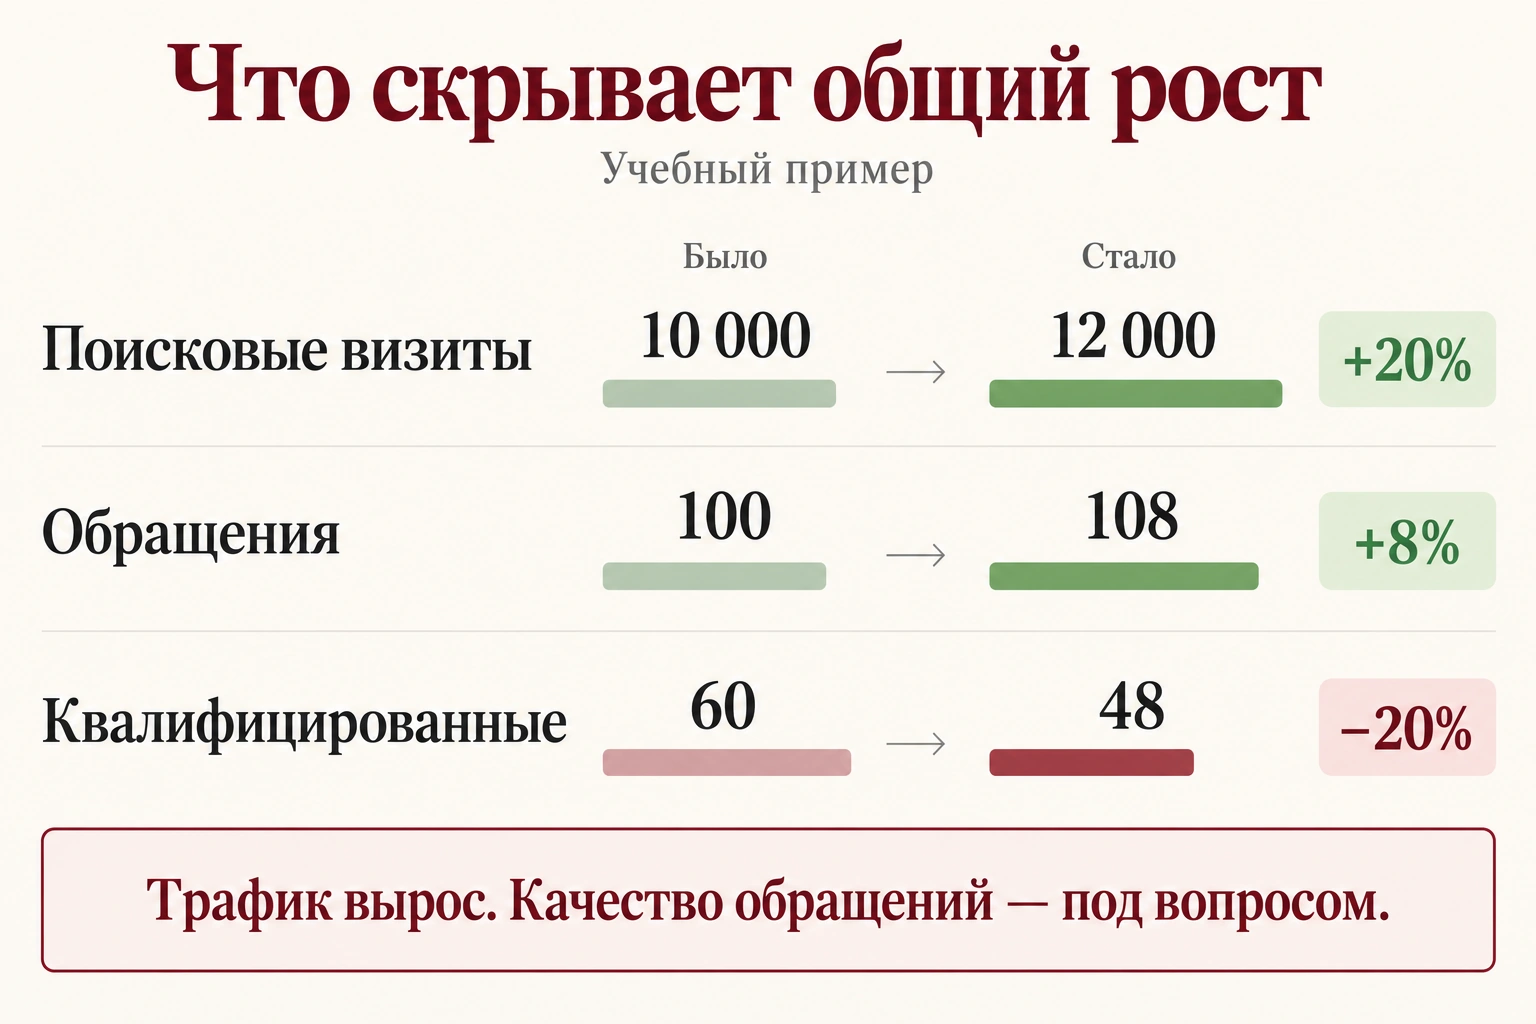
Imagine that search visits grew from 10 000 to 12 000. The agency reports: “Traffic +20%.” That is true. But a manager needs a few more lines.
| Metric, illustrative example | Previous period | Current period | Change |
|---|---|---|---|
| Search visits | 10 000 | 12 000 | +20% |
| Unique inquiries | 100 | 108 | +8% |
| Qualified inquiries | 60 | 48 | −20% |
| Inquiries / visits | 1,00% | 0,90% | −0,10 pp |
| Qualified / all inquiries | 60,0% | 44,4% | −15,6 pp |
The growth in traffic has not disappeared. But now it is clear that the next task is to investigate the quality of inquiries. Perhaps the blog attracted students; perhaps the geography changed; perhaps a manager started tagging qualification differently. The report itself does not yet prove the cause.
Pay attention to percentages and percentage points. A change from 1,00% to 0,90% is a decrease of 0,10 percentage points, or 10% relative to the original conversion rate. If you simply label it “−0,1%,” the reader may interpret the number differently.
Separate traffic that serves different purposes
Overall traffic is useful as an overview. For management purposes, break it down at least into branded and non-branded queries, commercial and informational pages, priority regions and other territories.
Branded demand may grow after a conference, advertising campaign or media publication. This growth is useful for the business, but you cannot attribute it entirely to changed SEO titles without additional evidence.
An informational article can bring in many readers who are not yet choosing a contractor. That does not make the content useless: it has a different purpose. It is important to see whether people move on to a relevant service and whether they return later, to the extent the configured analytics allows.
| Segment | The question it answers | Possible action |
|---|---|---|
| Commercial pages | Is interest growing in what we sell? | Improve the offer and demand coverage |
| Informational materials | Are there useful next steps across the site? | Add relevant scenarios and links |
| Priority regions | Are we attracting visitors we can serve? | Clarify geography and terms |
| Brand / non-brand | What demand is driving search growth? | Separate the impact of brand awareness from expanded reach |
| Mobile devices | Are enquiries being lost on mobile? | Check the form and the availability of contact details |
Query classification rarely covers the entire sample: some phrases are unavailable, and some are hard to assign clearly to a group. Keep an “unclassified” row and document the rules. Use the same conditions for the next comparison.
Rankings: show the sample composition, otherwise growth is easy to manufacture
The metric “70% of queries in the top 10” loses its value for comparison if difficult queries were removed from the list this month and branded phrases were added.
A stable group is needed for comparison: query, search engine, region, device type, and measurement date. Show new queries separately or recalculate the history in a comparable way. Do not mix Moscow and all of Russia in the same column.
Ask to see not only the best rows, but also the groups: how many queries reached the top 3, the top 10, how many lost positions, and where pages are competing with each other. The meaning of the queries also matters. Ranking first for the company name does not replace visibility for the service you need to sell.
Average position in Search Console is an aggregated metric for the site’s highest result across the impressions counted; it is not a fixed position for a single query captured by a rank-tracking tool. The same report also provides clicks, impressions, and CTR, and the data can be segmented by pages, queries, and devices. Google Search Console metric definitions (opens in a new tab).
If clicks have increased while average position has worsened, check the query mix. The site may have started appearing for new phrases in lower positions. A single average value is not enough to declare success or failure.
Completed work should lead to specific pages
“Meta tags fixed — 120 items” describes volume. A manager needs to understand exactly which pages changed, why, and whether the work has been completed.
| Work | Proof of completion | How we observe the impact |
|---|---|---|
| Rewrote service pages | List of URLs, before/after versions, publication date | Search and enquiries for this group |
| Fixed duplicates | Example URLs, chosen solution, verification result | Crawling and indexing, accounting for the delay |
| Updated cards | What questions and information were added | Option selection, cart, enquiries |
| Simplified the form | Changed fields and tested submission flow | Successful submissions and data quality |
| Prepared new materials | Published URLs, expert, and sources | Visibility, reading, relevant clicks |
Separate “prepared”, “sent to the developer”, “published”, and “checked”. A task in the tracker has not changed the site yet. For technical changes, use the SEO audit checklist to agree on the acceptance method. If the effect has not appeared, first find out whether the change made it into the live version.
Don’t automatically link every increase to the most recent change. Results are influenced by demand, competitors, the product range, and website changes all at the same time. An implementation log helps you formulate a testable hypothesis instead of presenting a timing coincidence as proof.

Sales and attribution: agree on the rules before a dispute arises
A person may first arrive from search, return through an ad a week later, and submit a form after an email another month later. The answer to “who owns the sale” depends on the attribution model you choose.
In Metrica, attribution models distribute the contribution of sources differently. Therefore, periods should be compared using the same settings, or any changes should be explained separately. Record the model name in the report. Yandex Metrica Help on attribution models (opens in a new tab).
For long B2B sales cycles, it is useful to look at cohorts: what happened to the enquiries received in a specific month. Sales in the current month may have started long before it. Dividing today’s revenue by today’s SEO spend and declaring an exact ROI without taking the deal cycle into account is incorrect.
Also check exactly what is recorded in the amount field. Proposal value, contract value, money received, and gross profit are different metrics. If a report calls any of these figures “SEO revenue,” the budget decision will be based on ambiguity.
In the report, you can show “enquiries from organic search in April” and “sales from this group as of the review date” separately. For deals that are not yet closed, keep the current status. This is clearer than adding the forecast value of all open deals to actual receipts.
A report page you can use to make decisions
Below is the structure of a monthly management summary. Detailed tables and tasks remain available via the project’s internal links, but they do not get in the way of a first read.
Result. What changed in search and qualified enquiries; which periods are being compared.
Explanation. Which page groups drove the change and which reasons have been confirmed, and which are still being checked.
Implementations. What has been published and accepted; what has been prepared but is waiting for another team.
Obstacle. What limitation is holding back growth or reliable measurement; who is responsible for removing it.
Next step. No more than three priorities, with an owner, deadline, and evaluation method.
A list of twenty equally urgent tasks does not show priority. It is better to choose three changes the team can implement and measure than to carry over a large table of unfinished recommendations every month.
Separately highlight the decisions required from the business: approve service terms, allocate a developer, or review lead classification. Otherwise, the agency will be reporting on recommendations, while the manager waits for results from something that is not yet on the website.
Seven questions for a meeting with your contractor
- Which pages delivered the main growth, and do they match our commercial priorities?
- What changed in qualified enquiries under the same counting rules?
- Which implementations can we open and verify right now?
- Have the query set, analytics settings, or attribution model changed?
- Which conclusion cannot be drawn yet, and what data is missing?
- What is the biggest constraint: demand, the website, measurement, or enquiry handling?
- What three actions do you recommend for next month, and how will we know they have been completed?
If the contractor has not yet identified the cause, ask them to name the next check, the data needed, and the deadline. Its result should appear in the report a month later. This turns uncertainty into a task with an owner.
At the final meeting, record the decisions: what the team will release, what is waiting for business approval, and which question remains open. By the next report, these notes will provide a basis for checking what has been completed.
Do the agency report and the sales department’s data not match? We’ll start with a reconciliation: enquiry definitions, source settings, CRM statuses, and priority pages. After that, we can prepare a report that shows which work should continue.
Oshmanovsky A.O.
Agency Director
Business development strategy and the creation of effective digital solutions.


